
Creative analytics has a blind spot, and every performance team eventually falls into it. MotionApp can tell you, in clean auto-updating dashboards spanning Meta, TikTok, YouTube, and LinkedIn, that ad 47 is carrying the account. It cannot tell you where ad 47's source file lives, which of its five exports carries the client's approval, or why spinning it into three new placements will take a week.
So the honest comparison has two halves. Seven MotionApp alternatives below compete on the analytics job itself: reporting depth, AI tagging, and platform coverage. The eighth entry works the blind spot, keeping the winning creative findable, approved, and ready to multiply.
1. Triple Whale: best for ecommerce brands wanting analytics inside full-funnel measurement
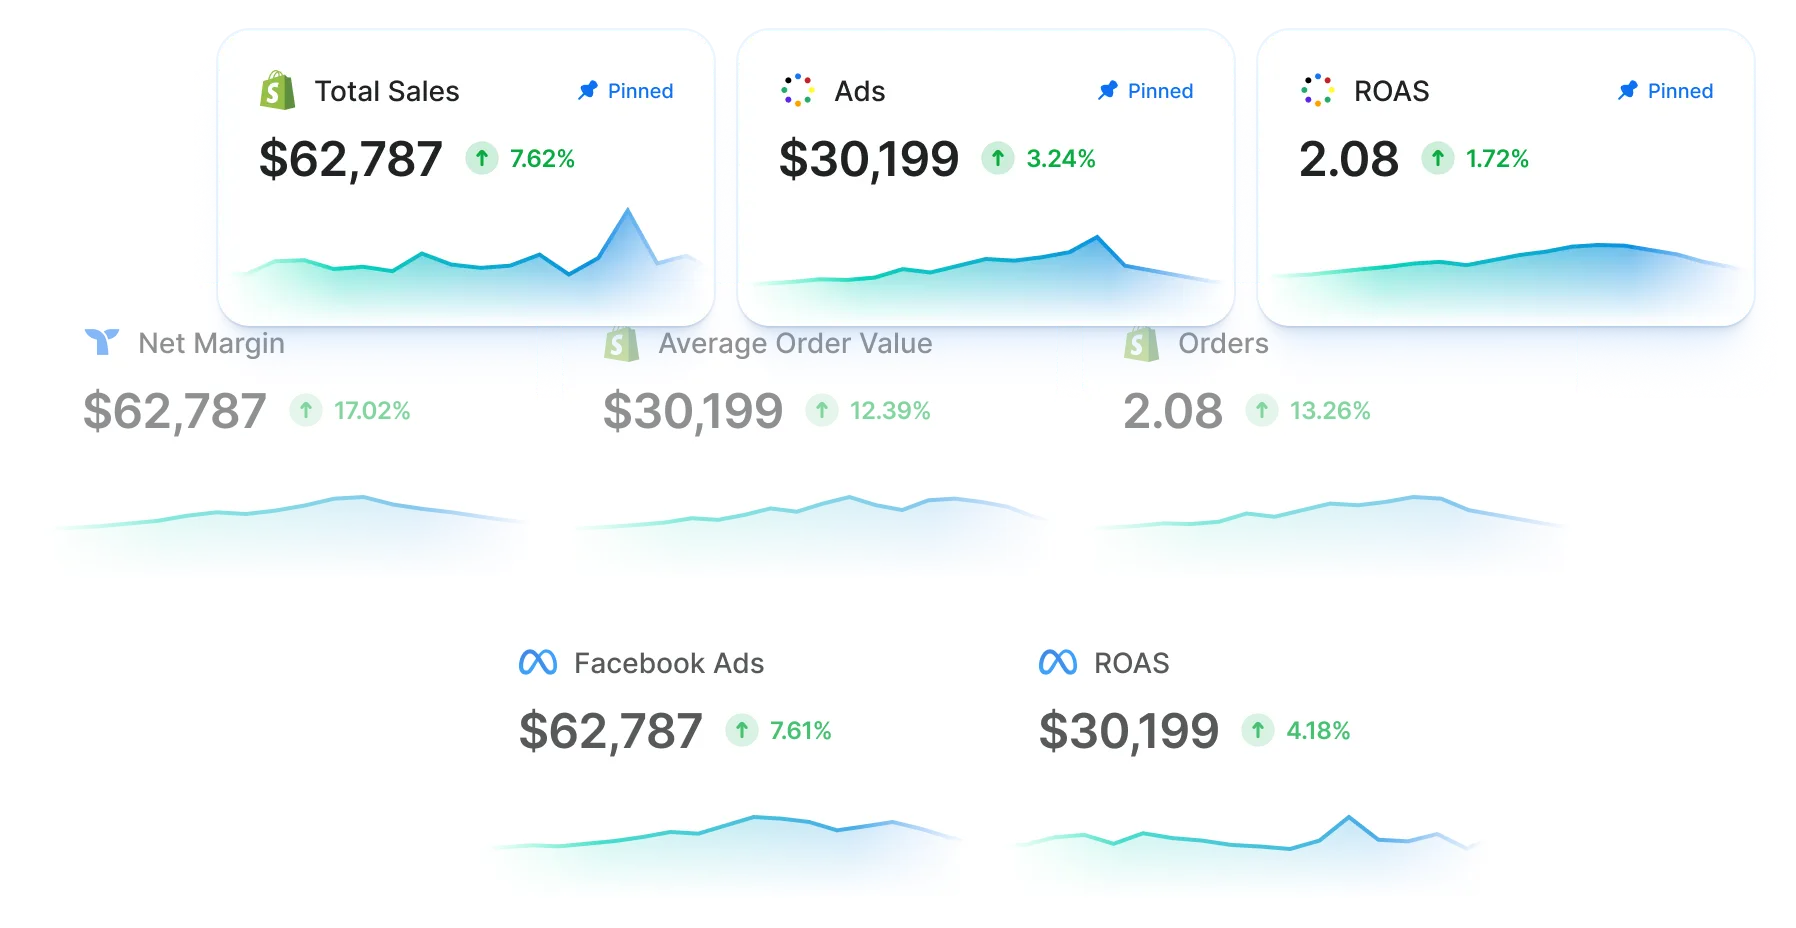
Triple Whale is a measurement and attribution platform for ecommerce, with creative analytics as one module inside pixel-based attribution, journey mapping, and revenue dashboards. For a Shopify brand already running Triple Whale, creative analytics adds a layer without adding a tool.
Strengths: Creative analytics embedded in full-funnel attribution; first-party pixel; revenue tied to specific creative; Shopify-native.
Limitations: Creative analytics is one module, not the focus; less relevant outside ecommerce or without Triple Whale attribution.
G2 rating: 4.5 out of 5 at the time of writing (481 reviews).
Pricing: Free plan (Foundation Free). Foundation from $219/mo, Automate from $749/mo, Enterprise by quote.
2. Madgicx: best for Meta-heavy teams that want analytics and management together
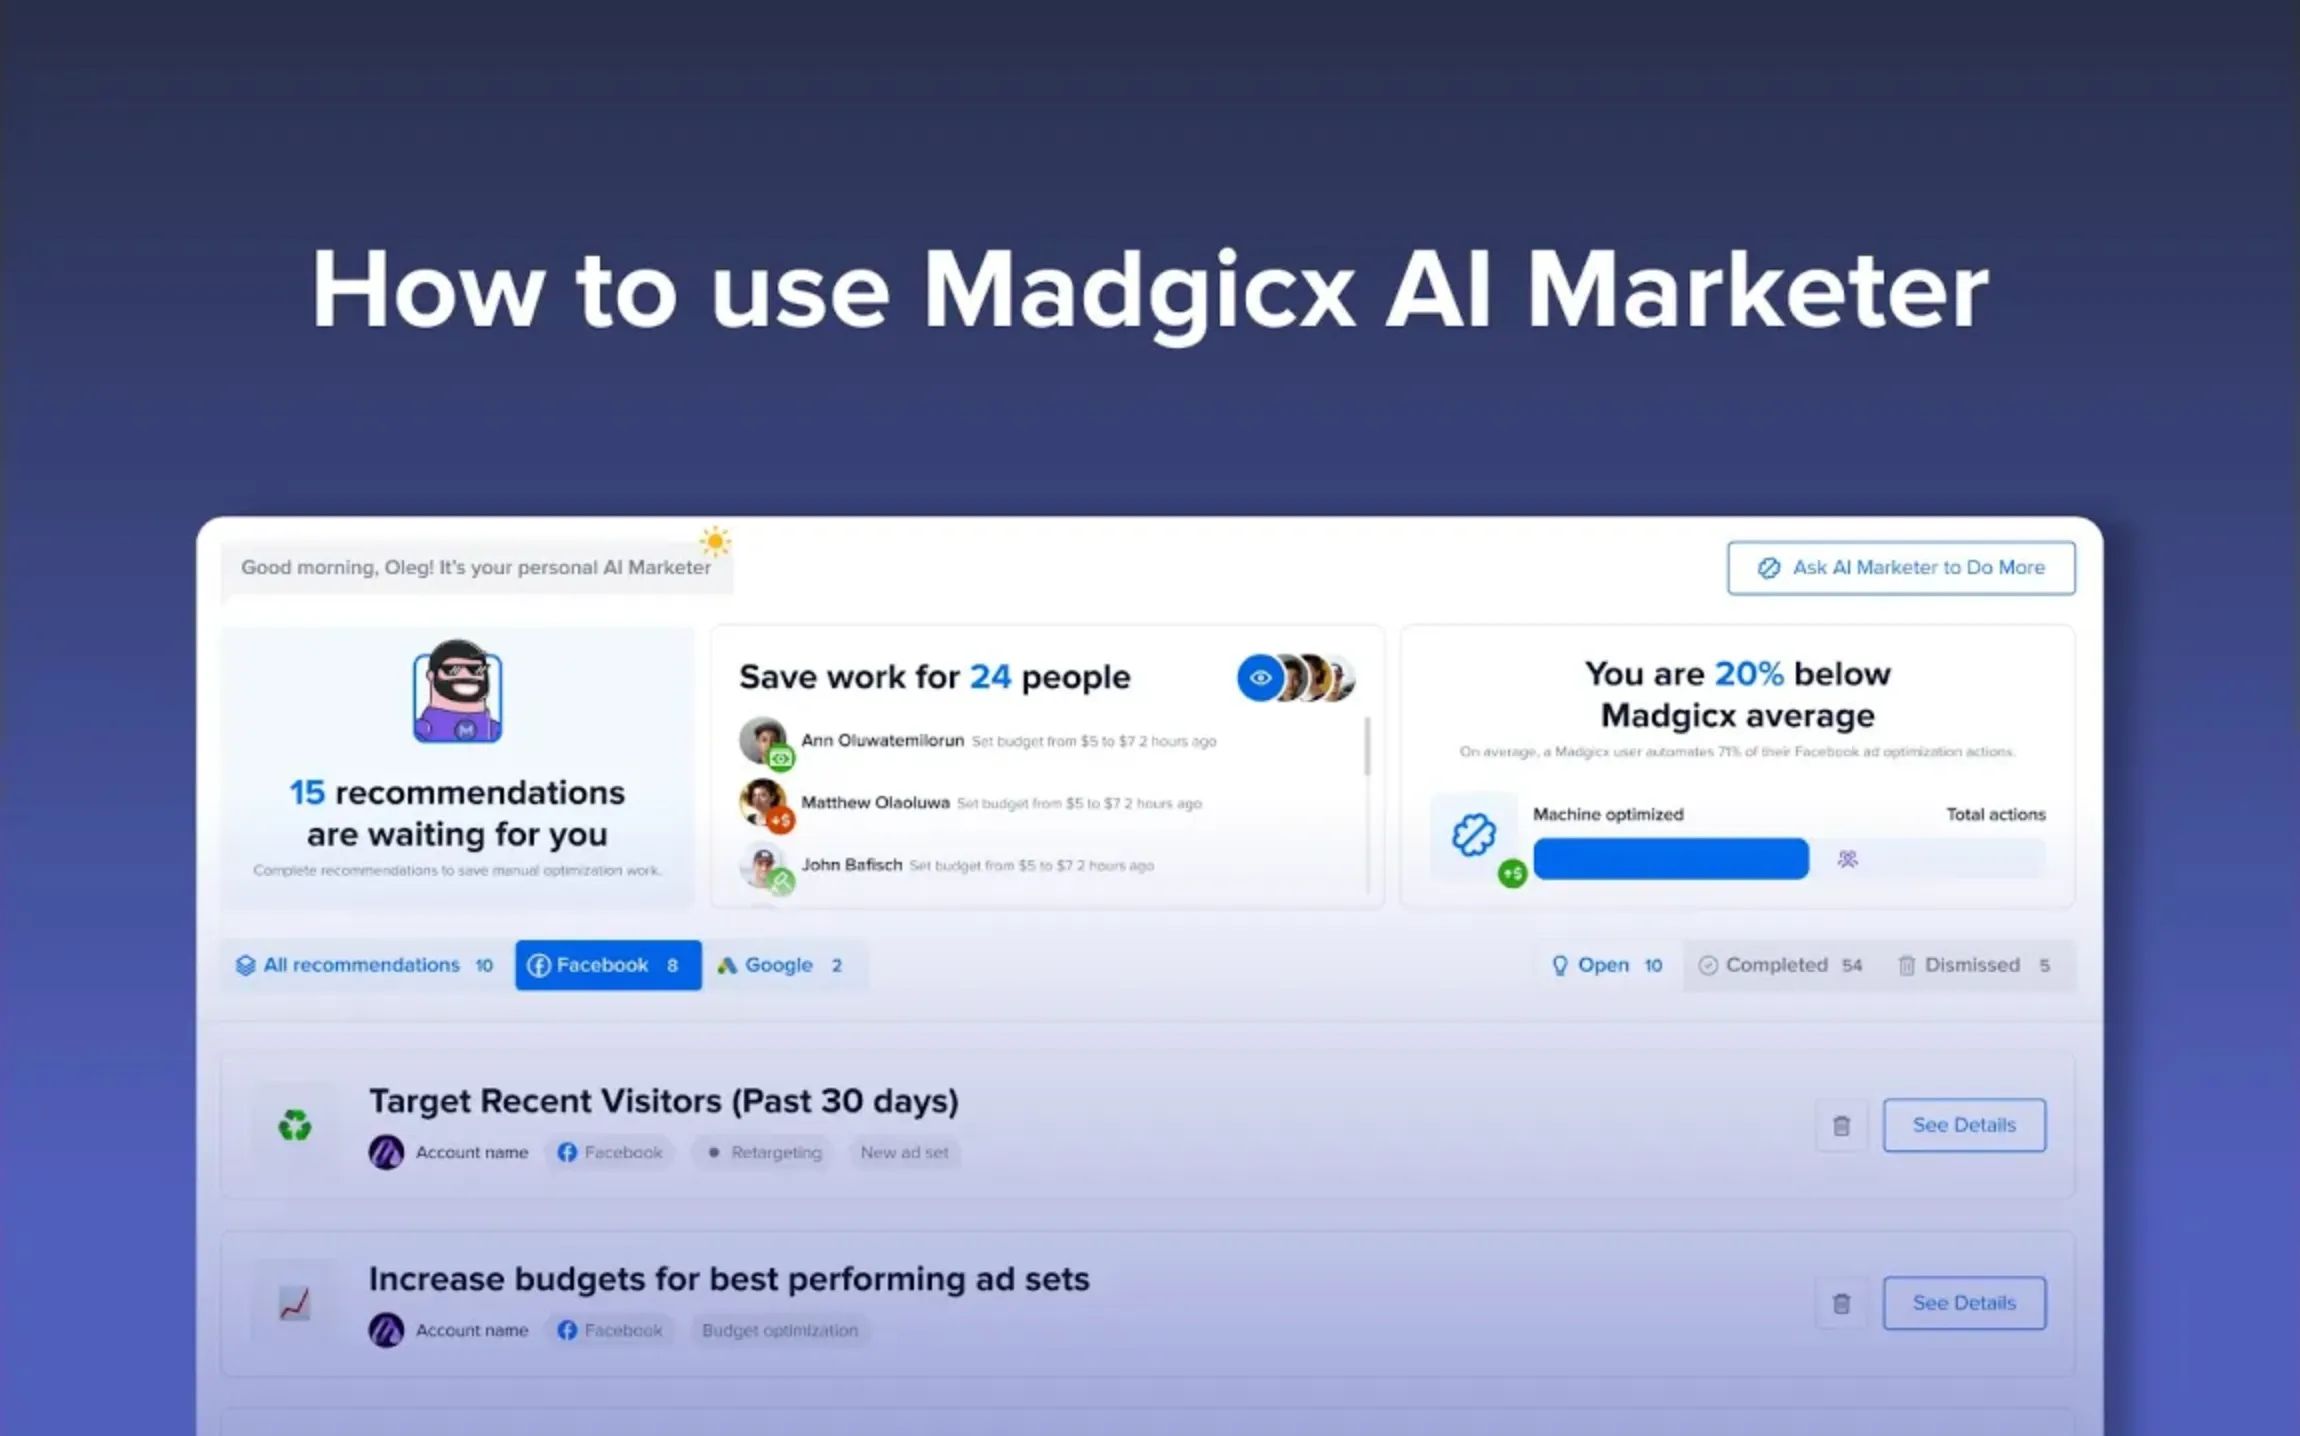
Madgicx pairs creative analytics with ad management, so Meta-focused teams can analyze performance and act on it in one place, with AI audience targeting and bid automation layered in.
Strengths: Analytics and ad management in one platform; AI targeting and automated bidding for Meta; visual creative reporting; ad launcher for fast variation.
Limitations: Heavily Meta-focused, thin on other platforms; broad feature set feels complex if you only need analytics.
G2 rating: 4.6 out of 5 at the time of writing (211 reviews).
Pricing: Spend-based, from $32/mo under $1K spend up to $230/mo at $20K–$30K.
3. Foreplay: best for discovery-led creative teams
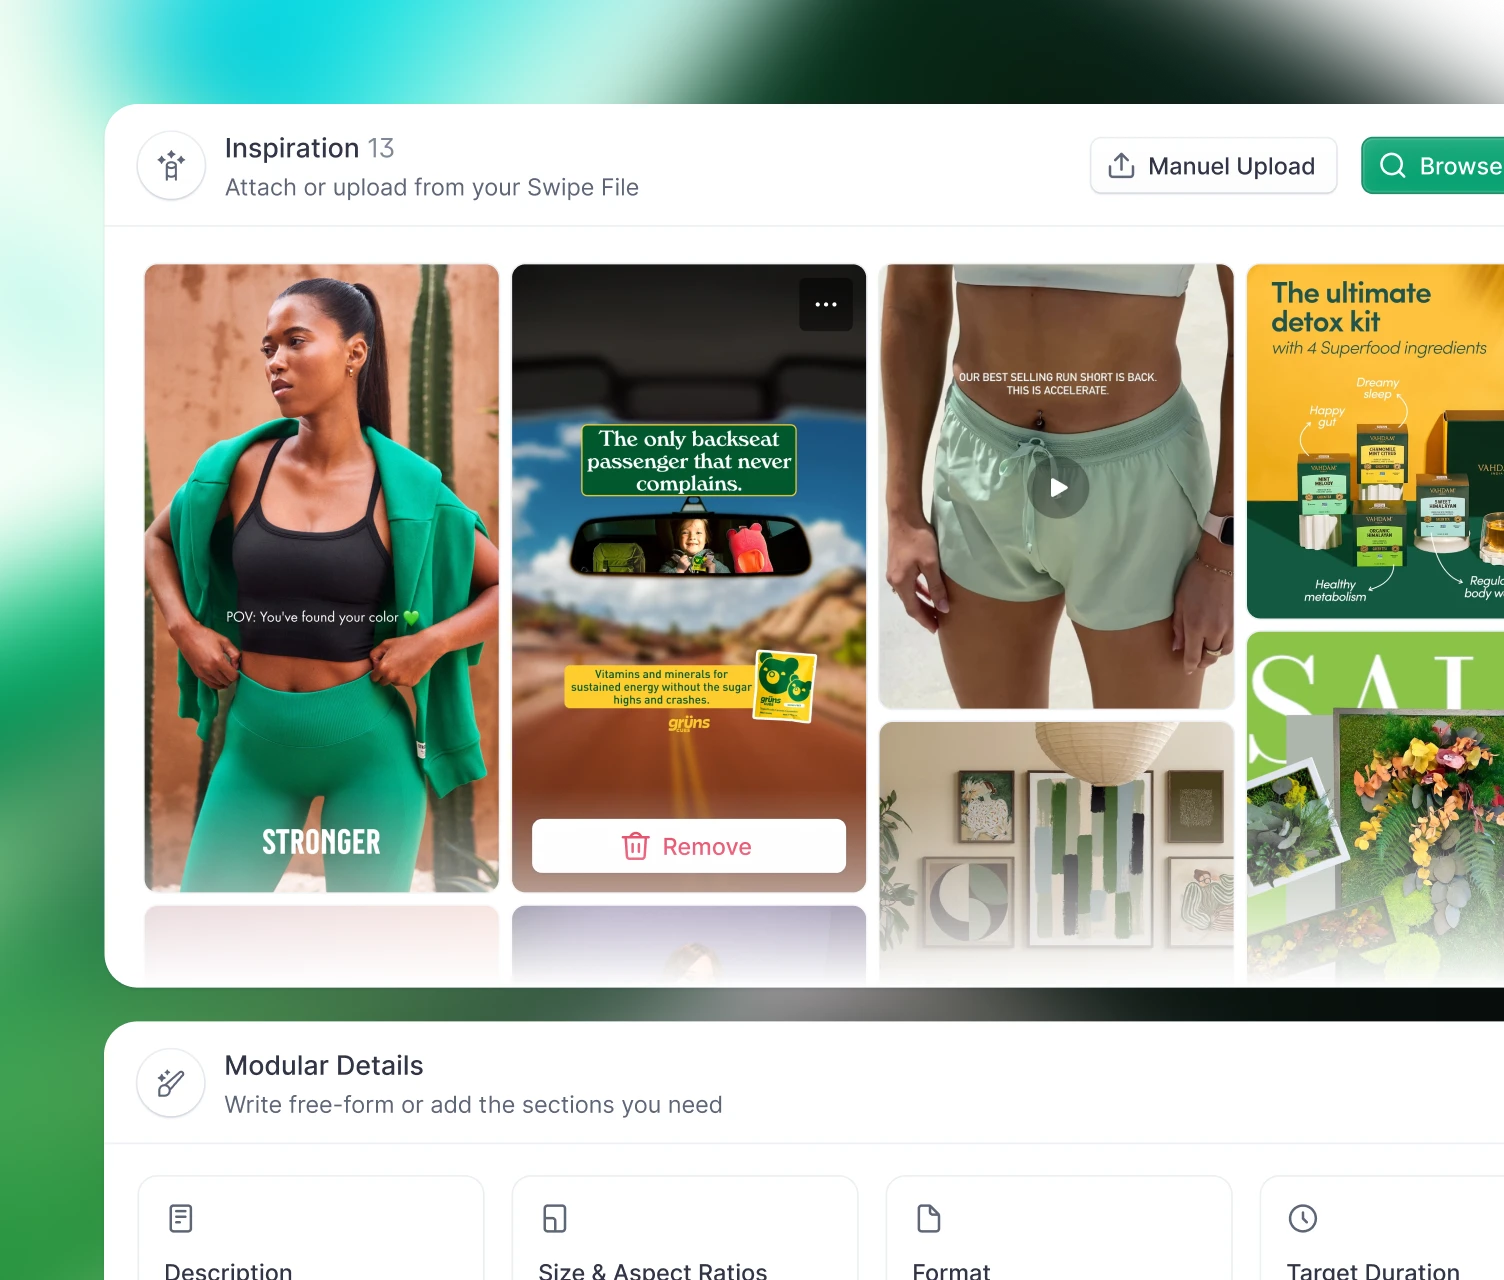
Foreplay is built for teams that start by studying what already works. It combines a searchable ad swipe file with competitive analysis, so teams save, organize, and brief from winning ads across Meta, TikTok, and LinkedIn.
Strengths: Massive searchable ad library; save ads into shareable swipe files; AI briefs from saved inspiration; Chrome extension.
Limitations: Analytics are secondary to discovery; less useful for teams that don't begin from competitive research.
G2 rating: 4.8 out of 5 at the time of writing (124 reviews).
Pricing: No free plan (7-day trial). Basic from $49/mo, Workflow from $149/mo, Agency from $389/mo, Enterprise by quote.
4. Atria: best for AI-driven creative strategy
Atria uses AI to analyze creative and recommend direction, going past surface metrics to break down why elements work: color, copy structure, hook timing.
Strengths: AI analysis that finds patterns across winning ads; tracks creative trends over time; data-backed briefs; multi-platform in one view.
Limitations: Newer platform, smaller community; recommendations need your team's interpretation and context.
G2 rating: 5 out of 5 at the time of writing (22 reviews).
Pricing: Core from $129/mo, Plus from $479/mo, Business from $959/mo, Enterprise by quote.
5. Segwise: best for mobile, gaming, and DTC performance teams
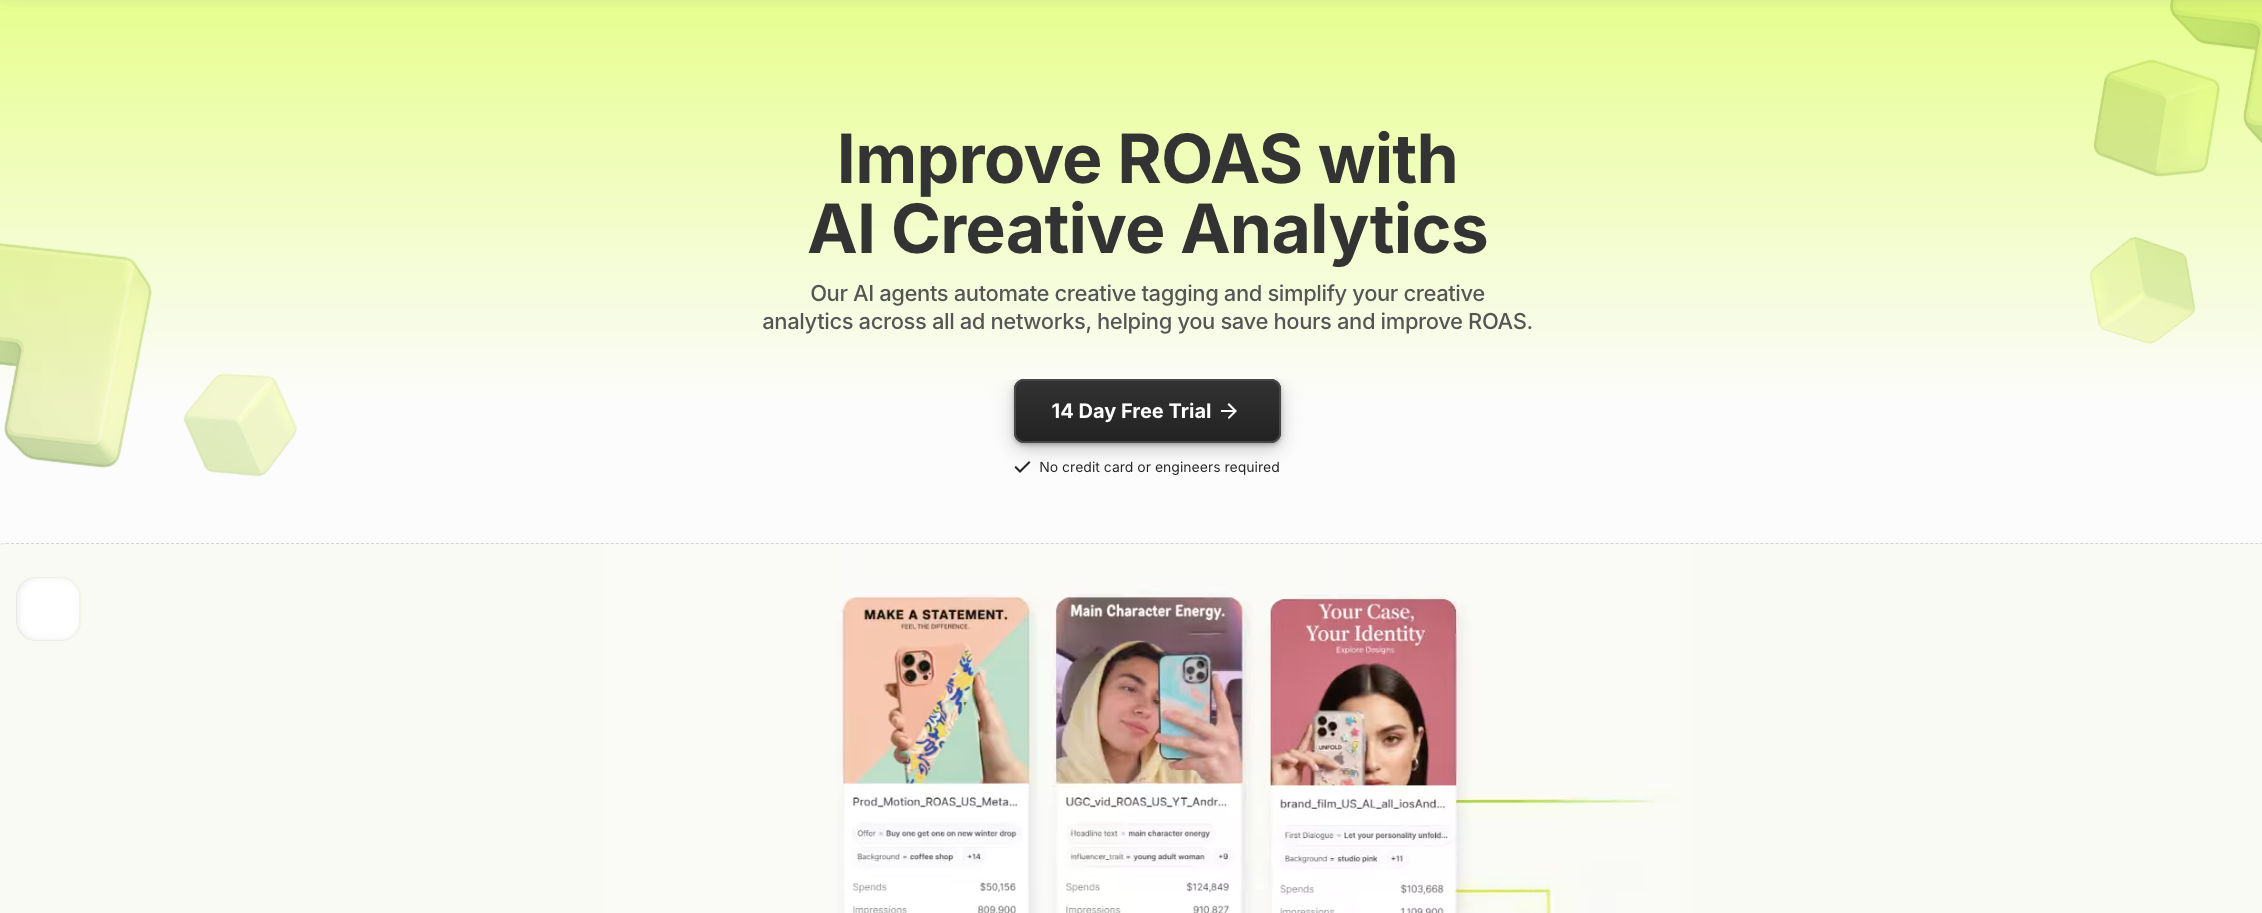
Most creative analytics tools center on DTC ecommerce. Segwise spans mobile app marketers, gaming studios, and DTC brands, applying AI tagging and analysis across those contexts.
Strengths: Covers mobile, gaming, and DTC in one platform; AI creative tagging with granular element breakdowns; automated anomaly detection; cross-platform beyond Meta.
Limitations: Less established brand recognition; more breadth than depth for single-vertical teams.
G2 rating: No reviews yet at the time of writing.
Pricing: 7-day free trial; paid pricing not published.
6. Superads: best for lean teams that want fast visual reporting
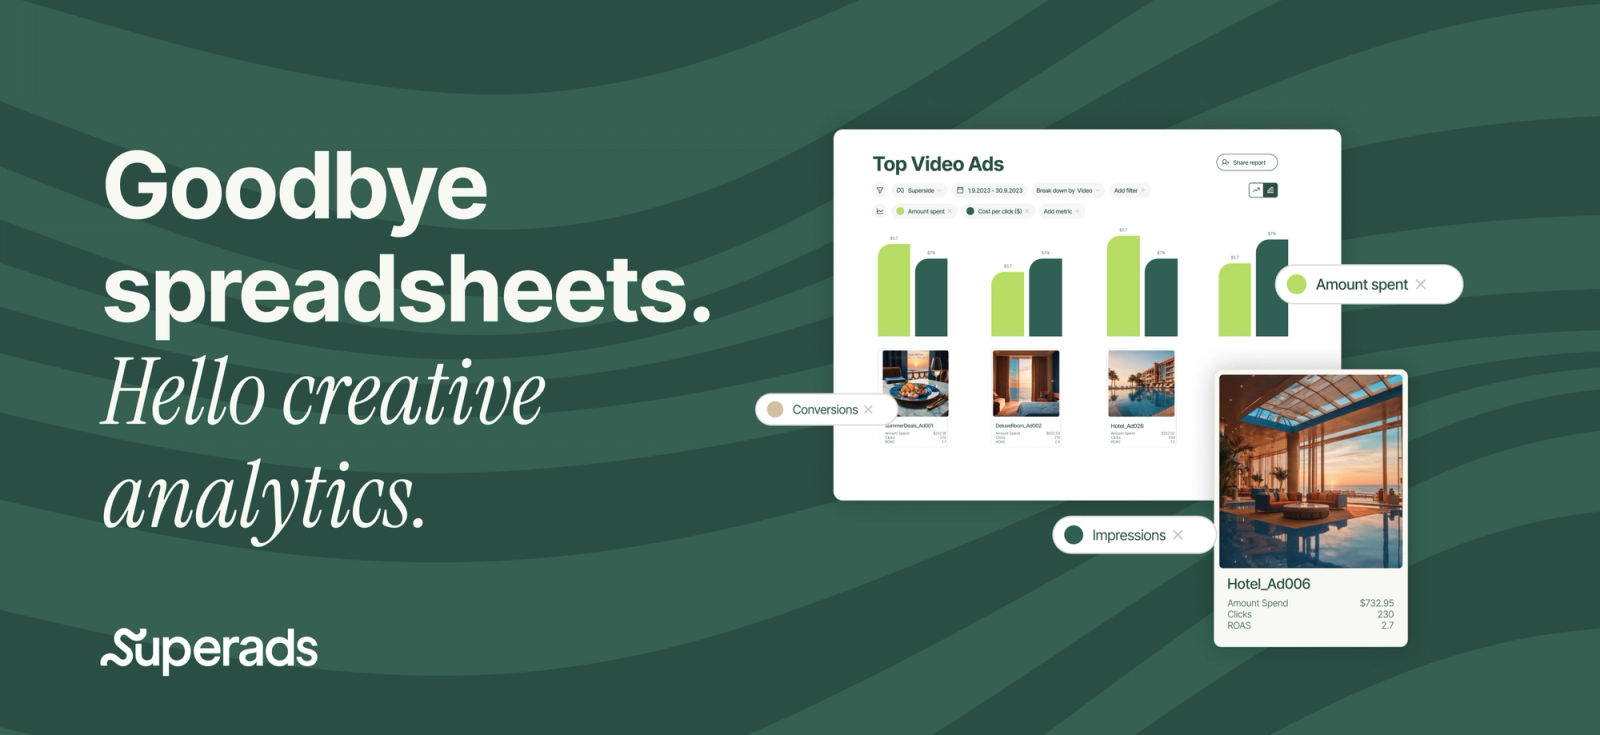
Superads does one thing: fast, visual, shareable ad reports. It pulls platform data and generates presentation-ready reports without hours of formatting.
Strengths: Clean visual reporting for sharing; fast setup with direct integrations; automated report scheduling; short learning curve.
Limitations: Reporting-focused, thin on creative-level AI analysis; not built for competitive research or briefing.
G2 rating: 4.7 out of 5 at the time of writing (7 reviews).
Pricing: No free plan (14-day trial). Professional from $150/mo, Enterprise by quote.
7. Uplifted: best for analytics with a built-in asset library
Uplifted's pitch is analytics with a place to keep the ads you measure. The storage half is genuinely useful for organizing creative by performance, but it stays an adjunct to the dashboard: design-round version history, multi-stakeholder approval, and channel adaptation all sit outside its scope.
Strengths: Combined analytics and asset library; tag creative by performance data; competitive benchmarking; AI creative insights.
Limitations: Library is analytics-first, not a creative ops hub; no version stacking or approval workflows; limited as a system of record.
G2 rating: 4.5 out of 5 at the time of writing (5 reviews).
Pricing: Free plan (3GB, 1 user). Starter $99/mo, Core $299/mo, Growth $499/mo.
8. Where the winning creative lives: Playbook
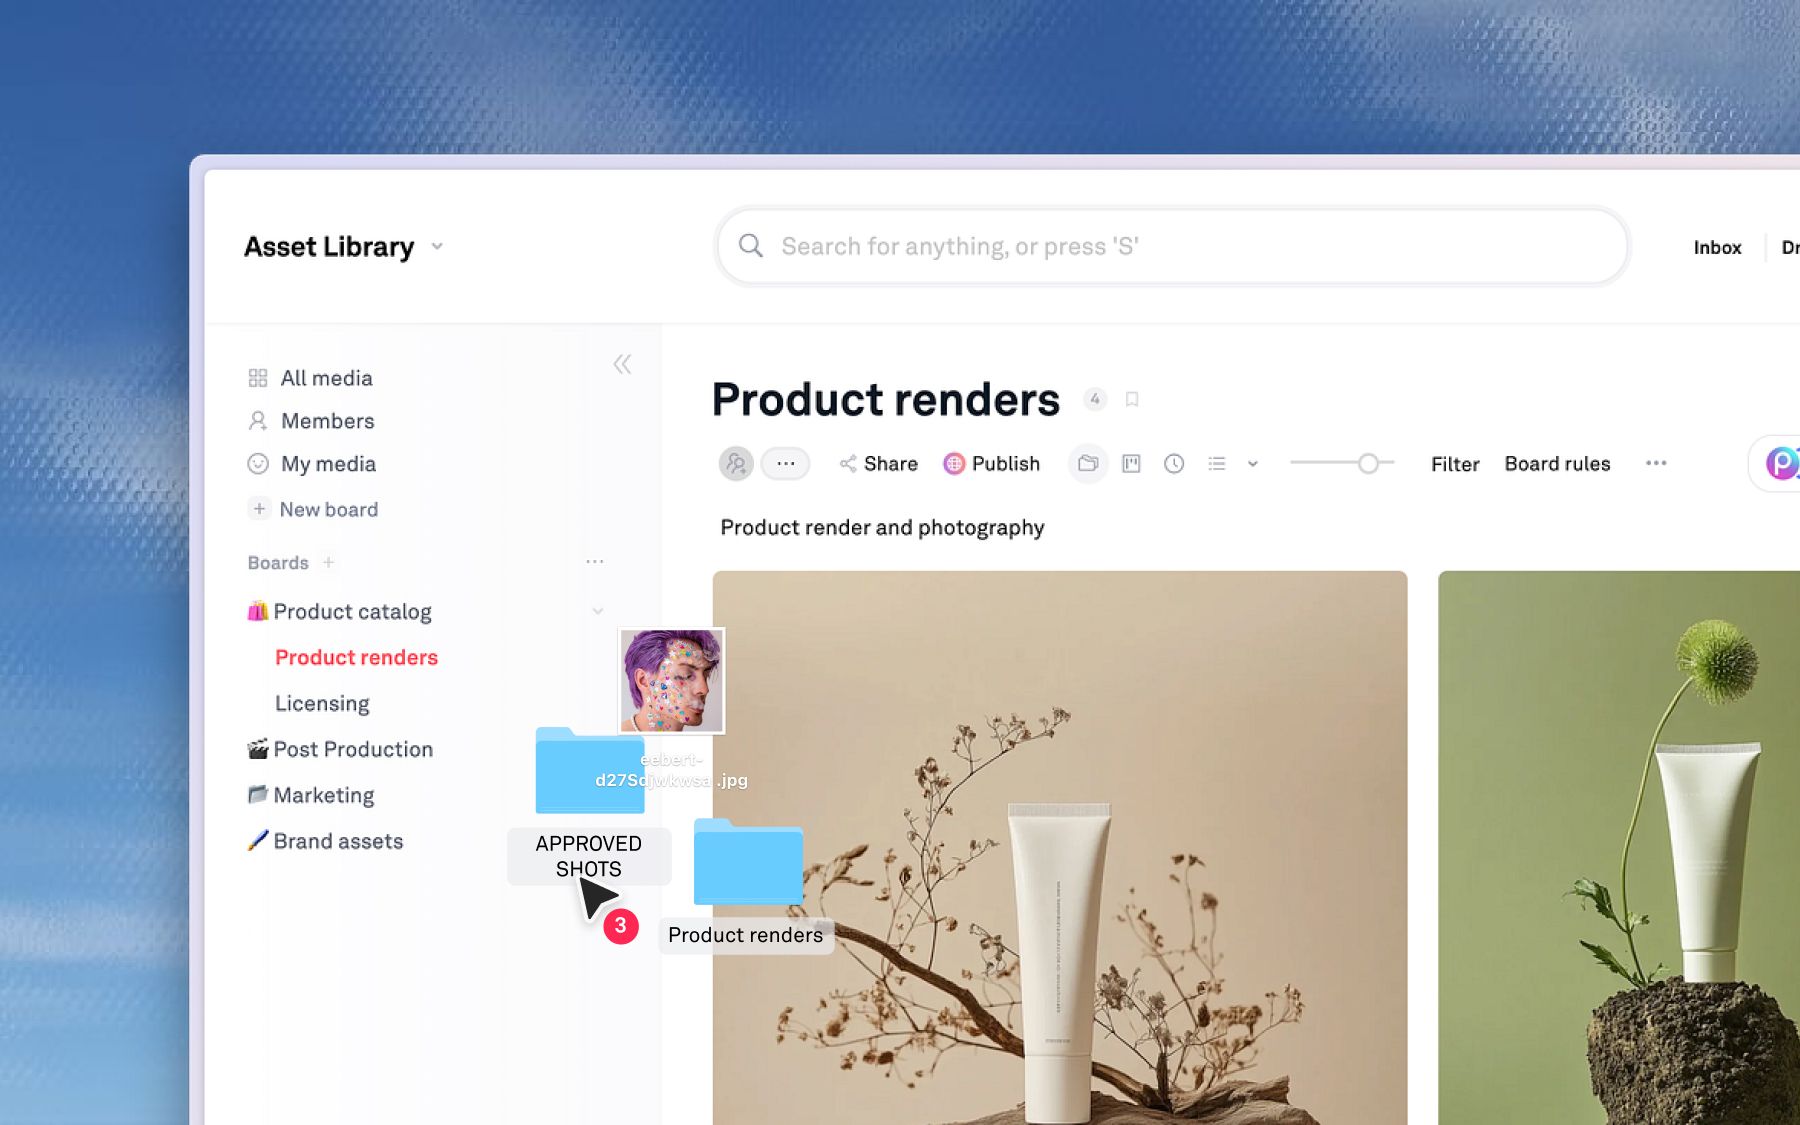
Playbook does not measure ad performance and will not pretend to. What it holds is everything the dashboard points at: the winning ad's source file, its full version history, the feedback that shaped it, and the approval that cleared it.
Analytics and asset management are complements and pair together to create a winning stack. The dashboard names the winner. Playbook is where the winner can actually be retrieved, rebuilt, and multiplied, and the gap between those two moments is where performance teams bleed time:
- Conversational search and auto-tagging. Playbook understands every asset by subject, mood, and brand elements and tags it on upload, so you search by what is in the creative ("the holiday hero with the green packaging") instead of guessing a file name.
- Version stacking. Every iteration layers on the original, so the winning cut and its full history live in one place, not across folders named "final" and "final final."
- Per-second review and approvals. Pin feedback to the exact frame or timestamp and track status through review stages, so the approved version is never in question.
- Publish and reuse. Turn one approved winner into on-brand variants and push them out as branded pages or share links.
Invictus Media, a Des Moines visual production house where video is 90% of the work, runs this way. The team moved off Dropbox, where finding a file meant digging through folder after folder, and now hands clients a single board instead. CEO JenniferKathryn King keeps Playbook open as one of three permanent tabs. The client handoff that used to generate "where is this?" emails is now a link. Read the Invictus Media story, or see how media and entertainment teams scale production.
When a paid team knows what is winning but cannot find, version, or scale it, that is a creative operations gap, not an analytics gap. Creative agencies running paid social feel it every launch.
Pricing: Free (100GB, up to 300 assets), Pro $12/member, Team $25/member, Business $400/mo flat. Unlimited guests on every plan, so clients and reviewers never need a paid seat. See the full pricing page.
Schedule a demo to see it against your own library.
How to choose
Diagnose before you shop.
Symptom: you cannot see what is working. Reports are manual and patterns stay invisible. Shop the analytics list: Triple Whale if you live inside Shopify attribution, Madgicx if Meta is your world, Foreplay if you brief from competitor research, Atria if you want AI reading the creative itself.
Symptom: you know exactly what is working and still cannot ship more of it. The winner exists somewhere, but nobody can produce the file, the approved version, or a fast path to new formats. No analytics tool fixes that. Playbook does, running alongside whichever dashboard you keep.
Mature paid teams usually end up with one of each, wired together: a dashboard to name winners and a library to make winning repeatable. Schedule a demo to see the second half in action.
MotionApp alternatives FAQs
Is MotionApp the same as the Motion AI calendar app?
No. MotionApp is a creative analytics platform for ad performance. Motion, the calendar app, is an AI task and scheduling tool. They are separate products for different jobs.
What is the best free MotionApp alternative?
Most creative analytics tools offer only limited free tiers or trials; Uplifted and Triple Whale have free plans. For the adjacent problem of organizing and scaling winning creative, Playbook's free plan includes 100GB of storage and unlimited guests.
Can Playbook replace MotionApp for creative analytics?
No. Performance measurement stays with MotionApp or one of its peers from this list. Playbook owns the other half of the loop, housing, versioning, approving, and adapting the creative those dashboards evaluate, so the two run side by side rather than head to head.
What is the difference between creative analytics tagging and asset management tagging?
Analytics tagging labels persuasion mechanics, hook style, format, and CTA type, so performance patterns surface in the data. Playbook's tagging reads the content itself: subjects, faces, on-image text, color, and mood. The first explains why an ad won. The second lets anyone find the winner and put it back to work.
Where should a team store its winning ad creative?
In a creative library, not a folder tree or an analytics tool's storage add-on. A library like Playbook keeps every winning asset with version history, approval status, and AI search intact, so the moment analytics flag a winner, the source file, its rounds of feedback, and its approval chain are already there.